Jordan Jenkins · 13 October 2026
Citizen Science Initiatives Reveal Shifting Bloom Cycles in Regional Wildflower Corridors
Observers note that citizen science programs across multiple continents have documented measurable changes in wildflower bloom timing over the past decade, with data sets extending through October 2026 showing earlier spring emergence in some corridors and delayed peaks in others. These initiatives rely on volunteers who record species presence, flowering dates, and environmental conditions using standardized protocols that feed into centralized databases maintained by research institutions. Researchers have compiled records from thousands of participants, allowing analysis of patterns that span hundreds of kilometers of connected habitats.
Project Structures and Data Collection Methods
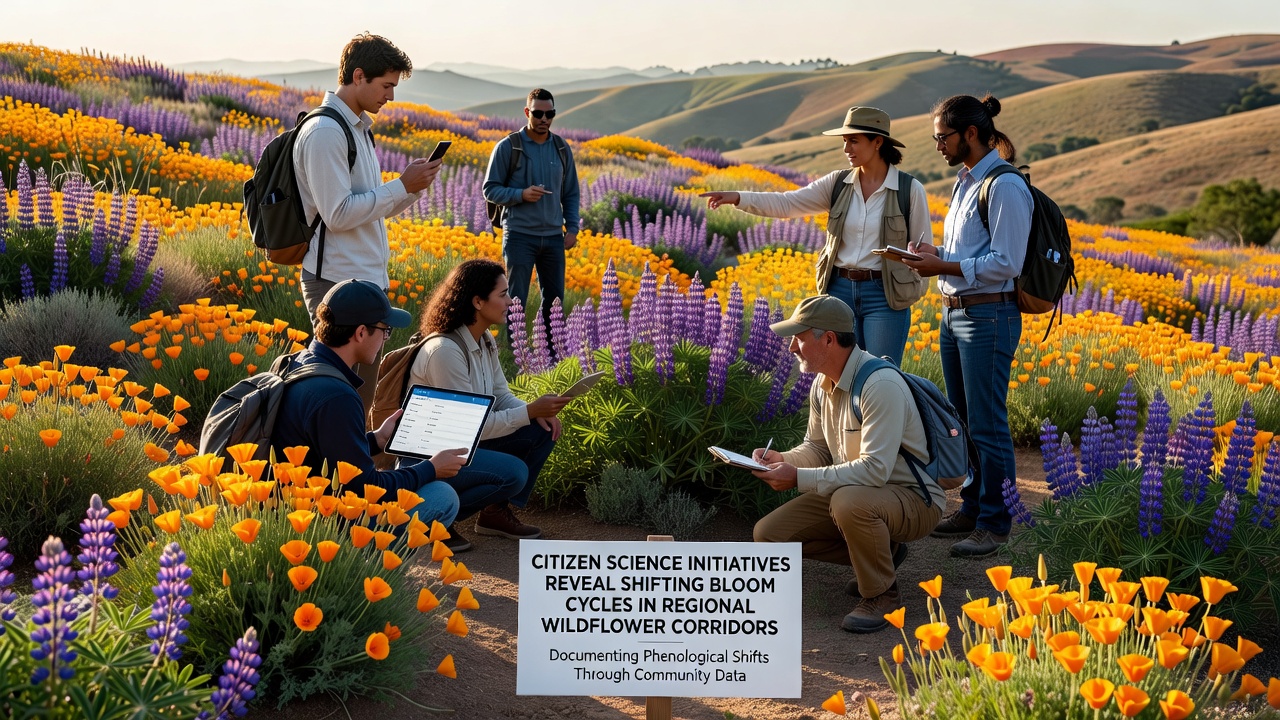
Programs such as those coordinated through regional conservation networks train participants to identify key species including lupines, poppies, and asters while noting first bloom, peak bloom, and senescence dates. Mobile applications sync observations with weather station readings, creating layered data sets that researchers cross-reference against historical records dating back to the 1990s. One study revealed that volunteer accuracy rates exceed 85 percent when protocols include photo verification and expert review, which supports integration of these records into peer-reviewed publications.
Training sessions occur at trailheads and community centers where experts demonstrate sampling techniques, yet participants often continue monitoring independently throughout the season. Data submission occurs weekly during peak periods, generating dense temporal coverage that satellite imagery alone cannot provide. This approach fills gaps in professional monitoring networks that lack sufficient field staff for continuous coverage across remote corridors.
Observed Shifts in Bloom Timing
Analysis of aggregated records indicates that average bloom onset for several native species has advanced by 8 to 12 days in northern corridors since 2015, while southern corridors show more variable responses tied to precipitation patterns. Figures from multi-year comparisons reveal that certain early-season bloomers now overlap with mid-season species, altering the sequential display that historically characterized these corridors. Researchers discovered correlations between these shifts and cumulative degree-day increases tracked by meteorological agencies.
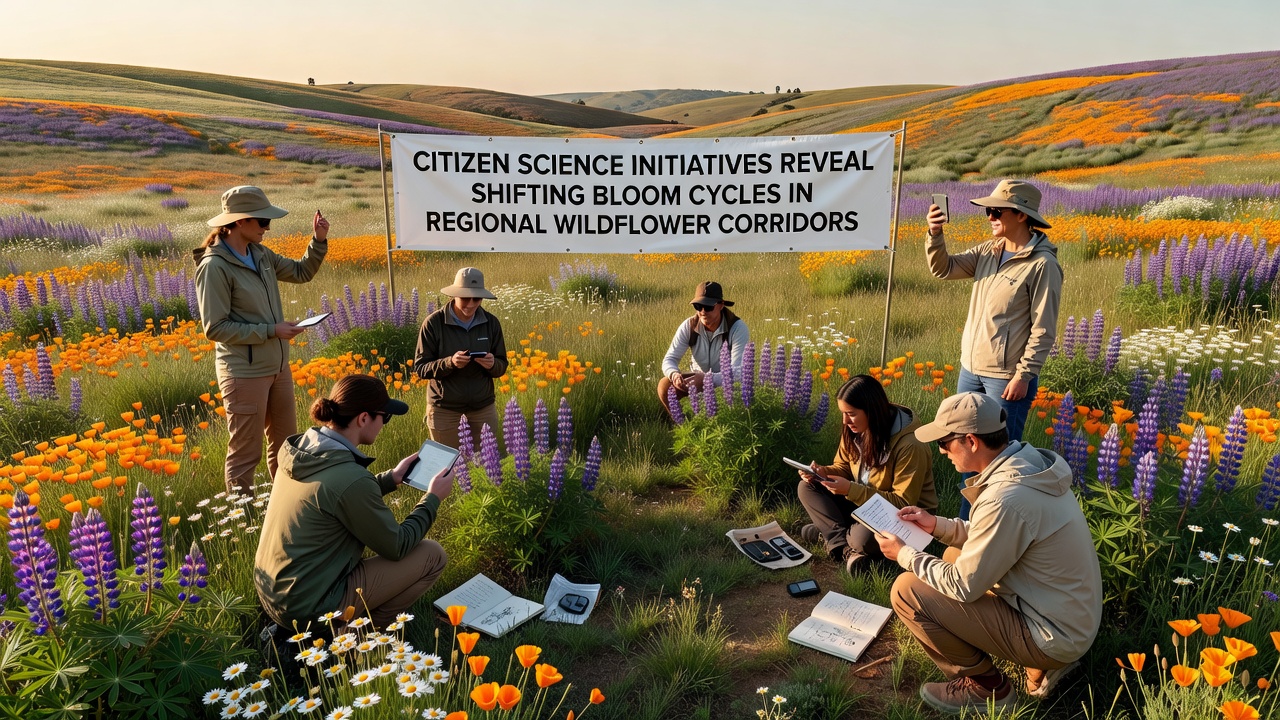
Take one corridor in the Pacific Northwest where volunteers recorded peak bloom for a dominant lupine species occurring in late April 2026 rather than the mid-May window observed in prior decades. Similar patterns appear in data sets from the Australian Alps, where researchers noted compressed flowering windows for alpine herbs during the 2025-2026 season. These changes affect pollinator synchronization because insects that time emergence to specific bloom cues encounter mismatches when plants respond more rapidly to temperature cues than to daylight length.
Regional Variations and Contributing Factors
Evidence suggests that elevation gradients produce distinct responses within single corridors, with lower elevations showing greater advances in bloom timing compared to higher sites that retain snow cover longer. Data from European monitoring networks indicate comparable elevation-dependent patterns, while Canadian programs report stronger precipitation influences in prairie regions. According to records maintained by the U.S. Environmental Protection Agency, temperature anomalies correlate more strongly with bloom shifts than any single other variable across tested models.
Yet precipitation timing introduces additional complexity because early rains can trigger germination that later drought conditions then suppress. Observers note that corridors experiencing both warmer springs and reduced winter snowpack show the largest cumulative advances, whereas sites with stable moisture regimes exhibit more modest changes. This geographic variation means that regional management plans must account for local data rather than applying uniform projections.
Integration with Broader Ecological Monitoring
Wildflower records now feed into larger biodiversity databases that track insect, bird, and mammal responses in the same corridors. Researchers combine these layers to model potential disruptions in seed dispersal and habitat suitability over coming seasons. Programs in New Zealand and South Africa have adopted similar citizen frameworks, allowing cross-continental comparisons that strengthen statistical power for trend detection.
What's interesting is how volunteer networks also capture rare events such as secondary blooming after unseasonal rains, events that automated sensors might overlook. These anecdotal yet verified observations add resolution to models that otherwise average across broad areas. The ball remains in the court of data managers who must maintain consistent quality control as participation scales upward.
Conclusion
Citizen science contributions have produced the most spatially extensive records currently available on wildflower phenology, revealing consistent directional shifts in bloom cycles across monitored corridors. These findings rest on repeated observations collected through structured protocols and verified through institutional review. Continued expansion of volunteer networks will likely refine understanding of how regional factors interact with larger climate trends, supporting evidence-based decisions for corridor conservation.